How do the instruments measure? What sample does each test need, and what data does it provide? Review the technical details of chemical, thermal, mechanical and color methods in this list.
Open each technique for sample and output details.
SEM
Microscopy and microstructure
Scanning electron microscope
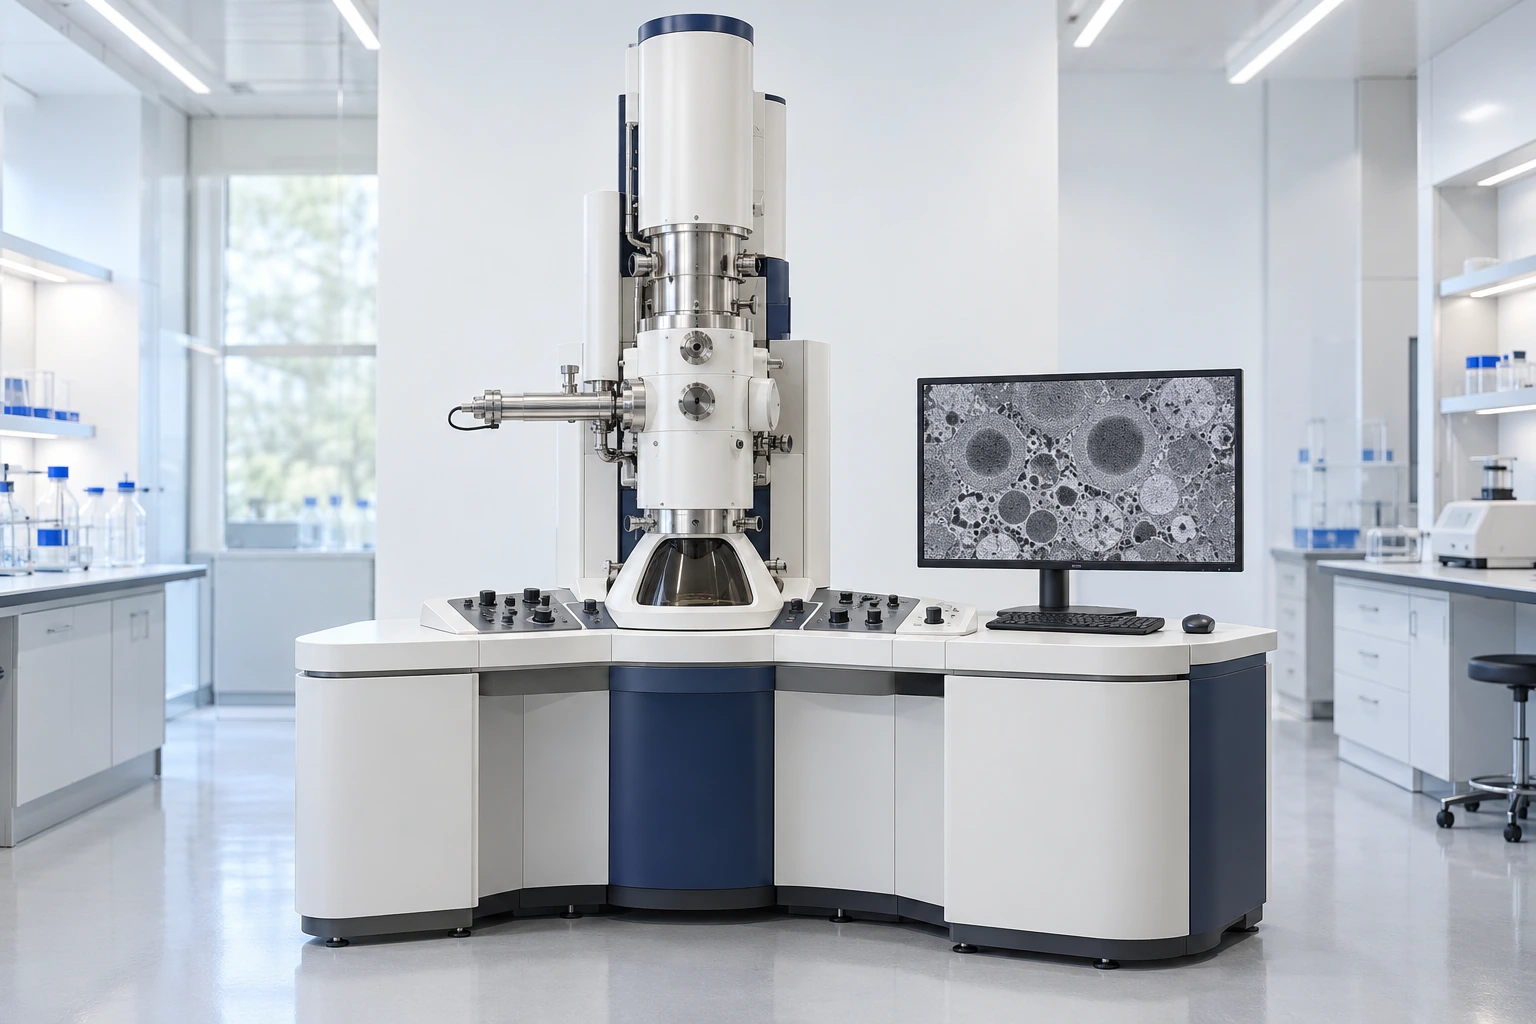
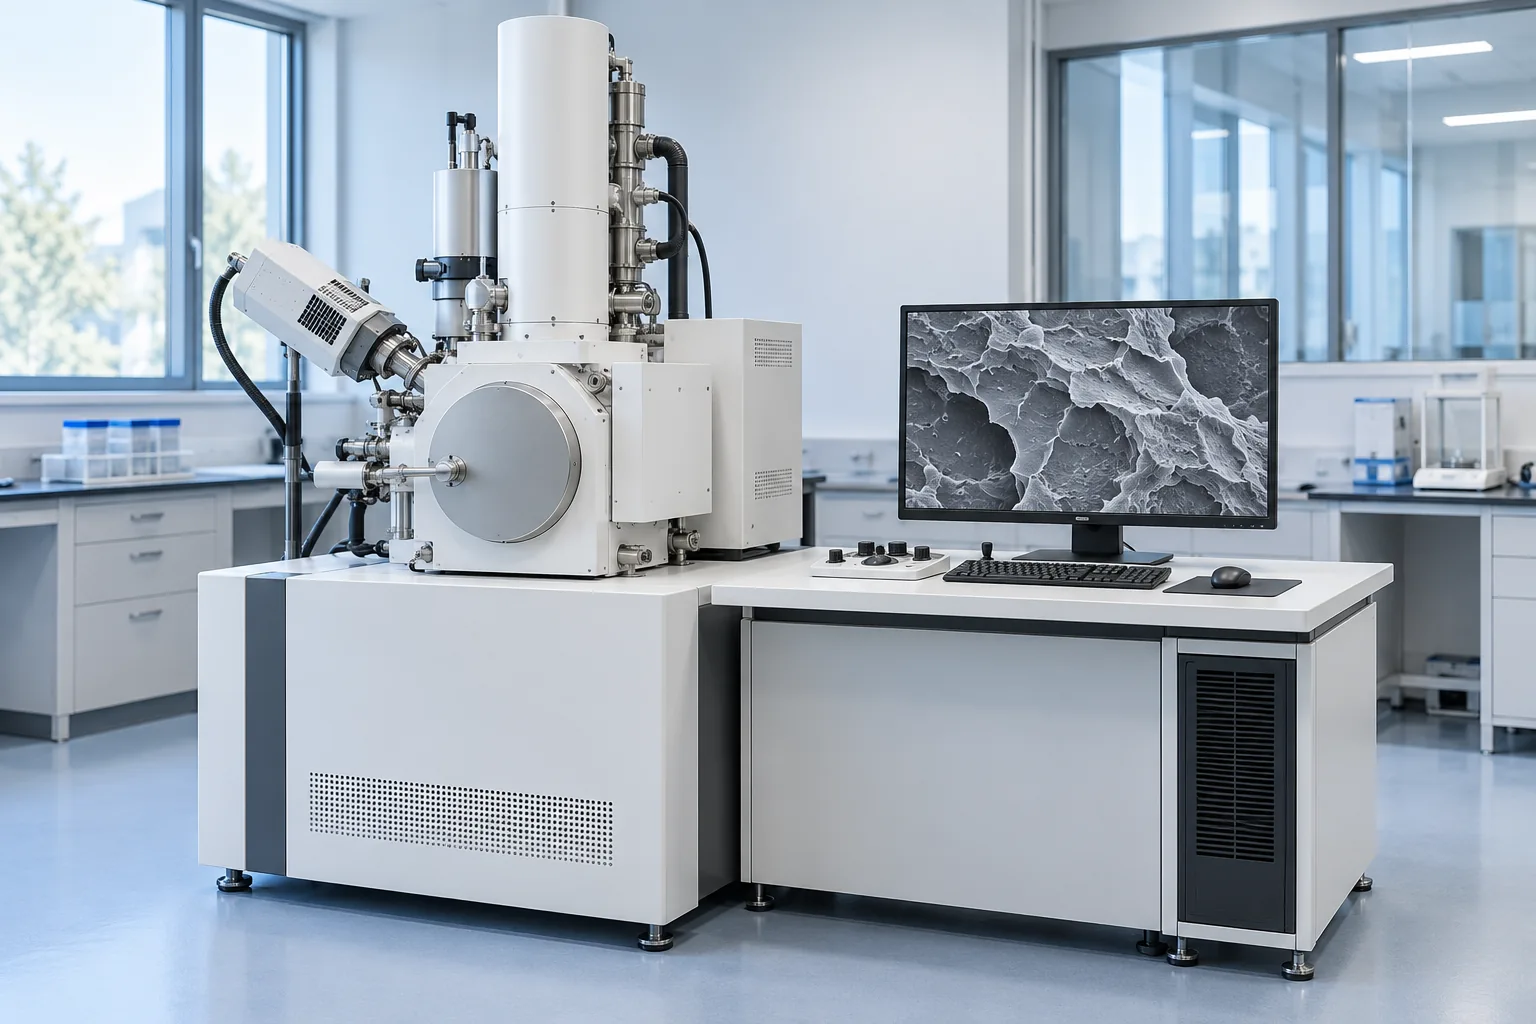
A focused electron beam scans the sample surface, and the secondary or backscattered electron signal is recorded to form an image. Images with a large depth of field show the surface morphology and microstructural detail of the polymer. Observing crack paths, fiber pull-out and interfacial debonding provides evidence about the fracture mechanism and the quality of bonding between components. Comparing filler dispersion and voids in good and defective samples helps assess the effect of mixing, processing and formulation; the result should be checked against mechanical data and the sample history.
Test, sample and output details
Polymer morphology and fracture surface examination
The surface, a cross-section or the fracture surface of the sample is examined to observe cracks, voids, phase separation and filler dispersion. Imaging representative areas at different magnifications makes it possible to compare samples.
Sample
Part, film, fiber, powder or fracture surface; preparation and dimensions to suit the chamber and the purpose of the investigation
Output
Micrographs with a defined scale; shape and size of defects and phase dispersion in the imaged areas
Limits of interpretation
Non-conductive polymers may need a conductive coating, low voltage or low vacuum. Beam damage and preparation affect the image; elemental identification requires a complementary EDS detector, and an SEM image alone does not establish chemical identity.
An electron beam passes through a very thin sample to image the internal structure of the material. Image contrast makes it possible to examine phase morphology and particle dispersion at the nanometer scale. Examining the size of dispersed phases and the agglomeration of nanofillers helps compare mixing quality and the compatibility of components. Comparing the microstructure of reference and production samples provides evidence for interpreting property changes and adjusting the formulation.
Test, sample and output details
Internal microstructure and nanoparticle dispersion in polymers
Ultra-thin sections of polymers, blends or nanocomposites are examined to observe the size and shape of phases, particle agglomeration and interfaces. Where the sample and instrument allow, electron diffraction also provides complementary information on crystalline structure.
Sample
Ultra-thin section or electron-transparent film on a grid, typically less than about 100 nm thick. Soft samples may require cryo-sectioning, and some polymers selective staining.
Output
Images of internal structure with a defined scale; size and distribution of phases and particles in the imaged areas
Limits of interpretation
Beam damage, section thickness and preparation affect contrast and interpretation. A two-dimensional image does not represent the whole sample volume and does not, on its own, establish chemical composition.
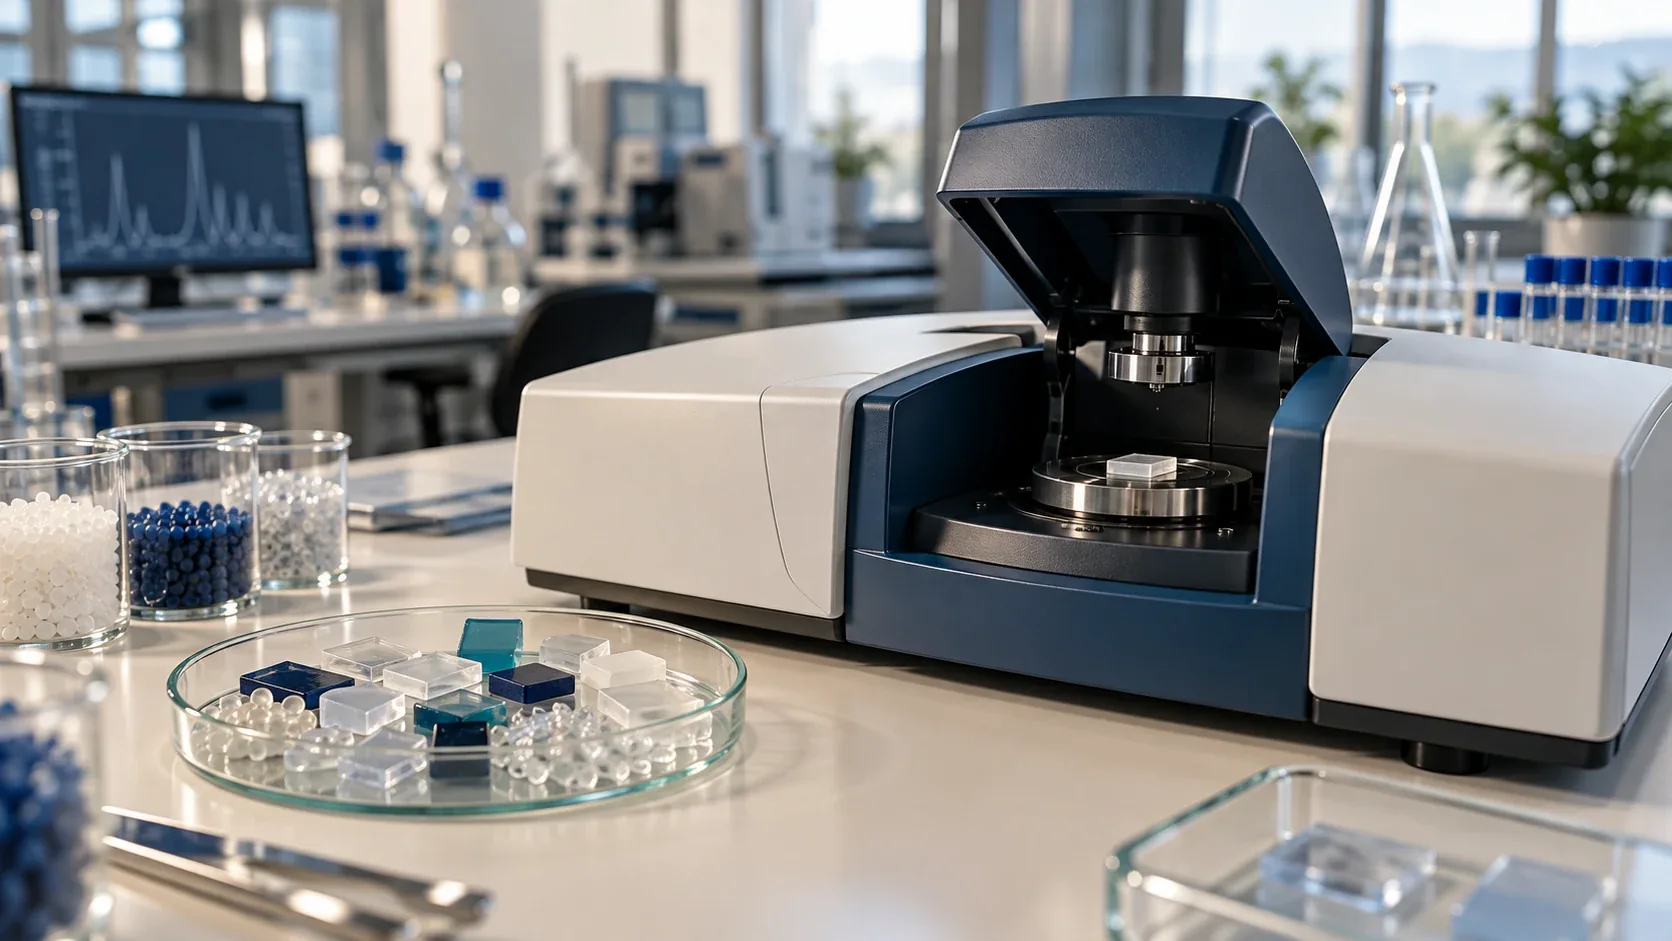
Records the absorption of infrared radiation by chemical bonds. The spectral pattern is used to identify the polymer family and compare the composition of samples. Comparing the absorption bands of a defective sample with a good one can reveal differences in functional groups, the presence of an unwanted material or chemical change in the polymer. This evidence helps test hypotheses such as the mix-up of an incorrect material or contamination, and narrows the investigation of raw materials and the process.
Test, sample and output details
Chemical identification of polymers
The sample spectrum is compared with a reference spectrum or library to examine functional groups and the likely polymer family.
Sample
Film, granules, part, powder or resin, depending on the preparation method
Output
Infrared spectrum and interpretation of characteristic regions
Limits of interpretation
Surface coatings, contamination and overlapping component spectra can make blends difficult to interpret.
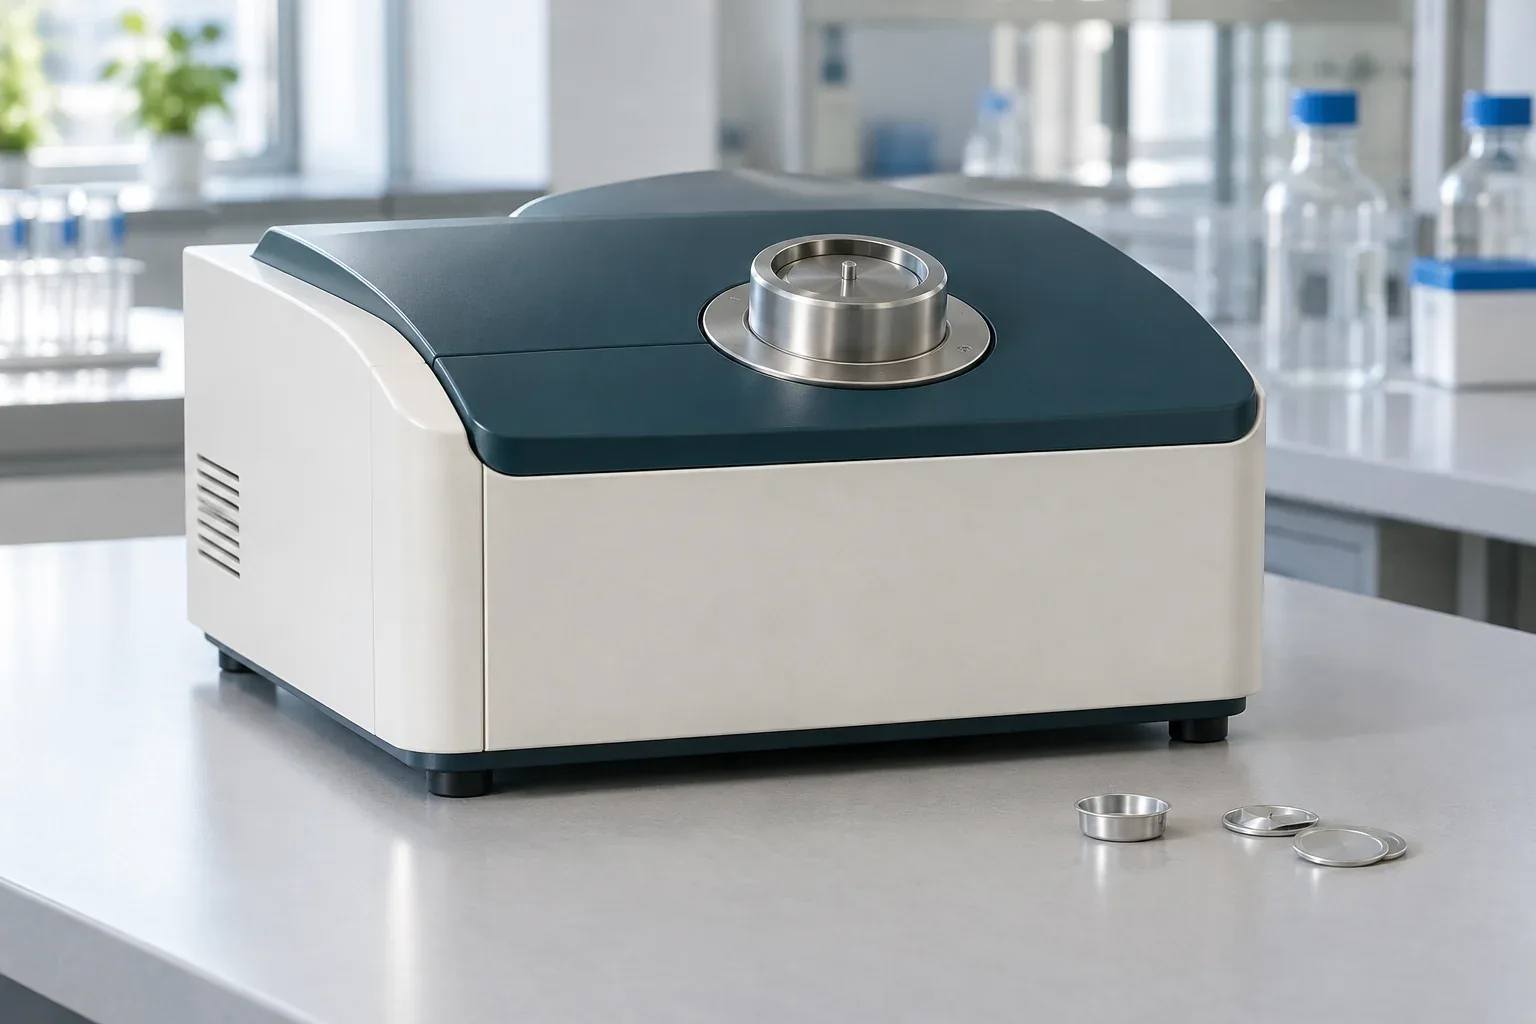
Measures the difference in heat flow between a sample and a reference over a temperature program; used to examine the thermal transitions of polymers. Comparing the glass transition, melting and crystallization temperatures of samples under the same thermal program shows differences in their thermal behavior and processing history. These data help investigate batch-to-batch quality differences and review heating and cooling conditions, but the cause of a change must be confirmed against material and production information.
Test, sample and output details
Thermal transitions
Melting, crystallization and glass transition behavior is examined under a defined heating or cooling program.
Sample
A small amount of polymer sample in a suitable test pan
Output
Heat-flow curve and observed thermal transitions
Limits of interpretation
Thermal history and the rate of temperature change affect the result.
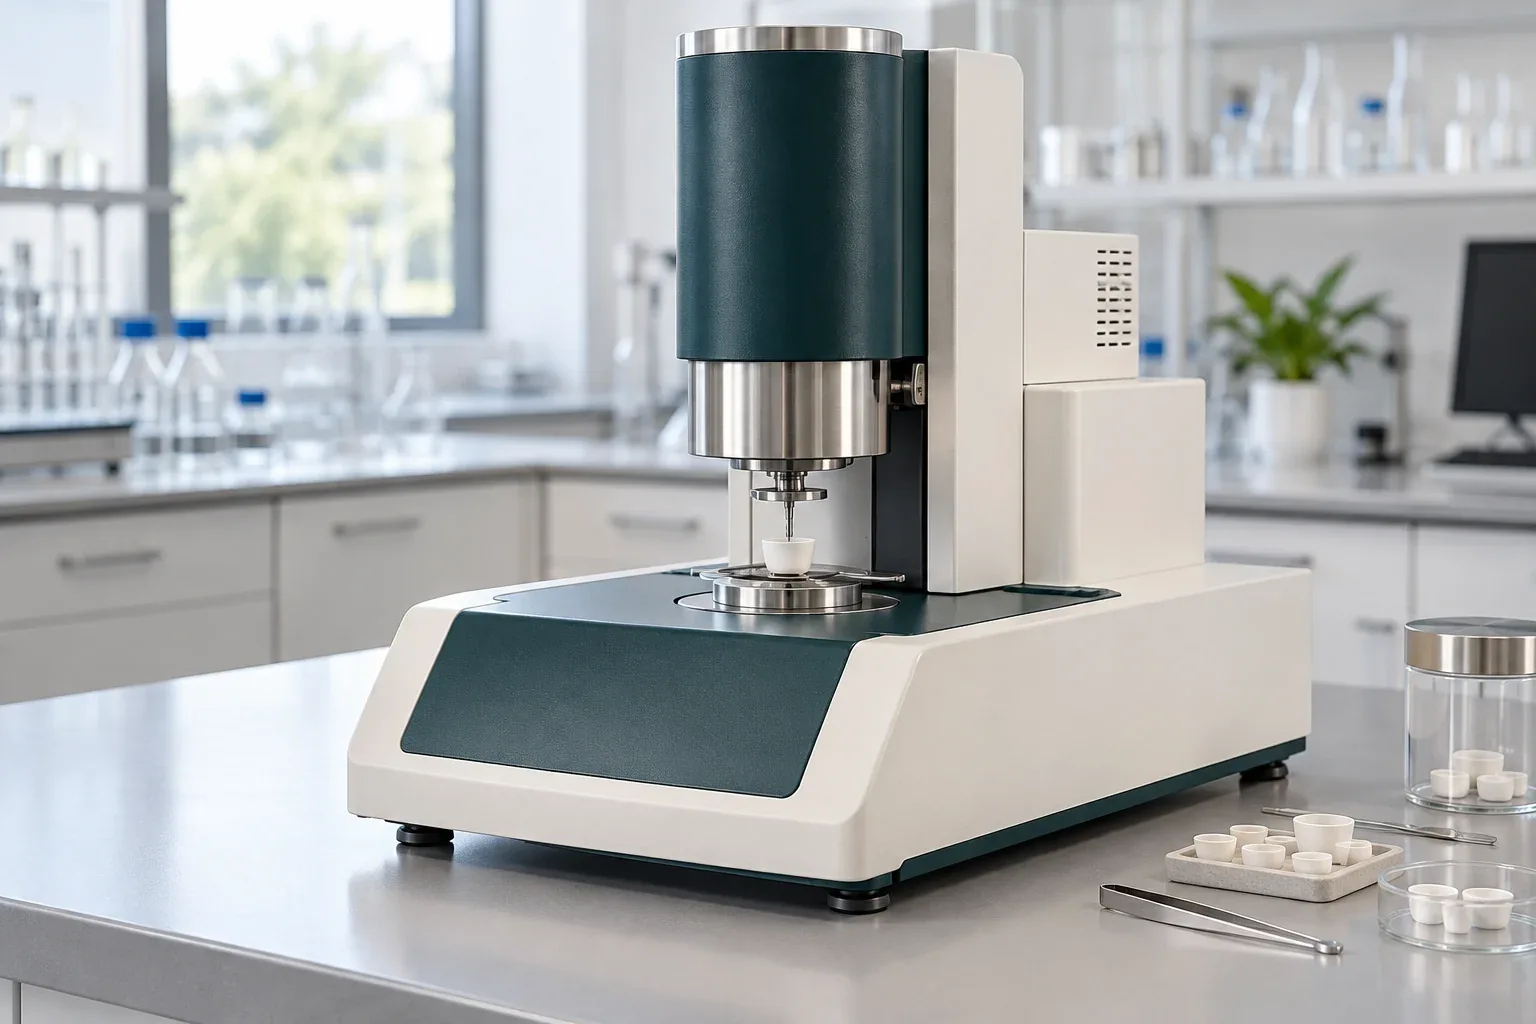
Records the sample mass as the temperature changes or over time; used to examine mass loss and residue. Comparing the mass-loss steps and the residue under a defined atmosphere and temperature program is useful for examining differences in volatiles, decomposition behavior and the likely share of inorganic components. The results help assess changes in composition or thermal sensitivity; the onset temperature of mass loss in this test is not, on its own, the permissible service temperature of the product.
Test, sample and output details
Mass loss and residue
Mass-loss steps, release of volatiles and decomposition behavior are assessed under a defined atmosphere and temperature program.
Sample
Polymer sample with information on likely composition and safety
Output
Mass versus temperature or time curve, and residue content
Limits of interpretation
Mass loss alone does not identify the material released.
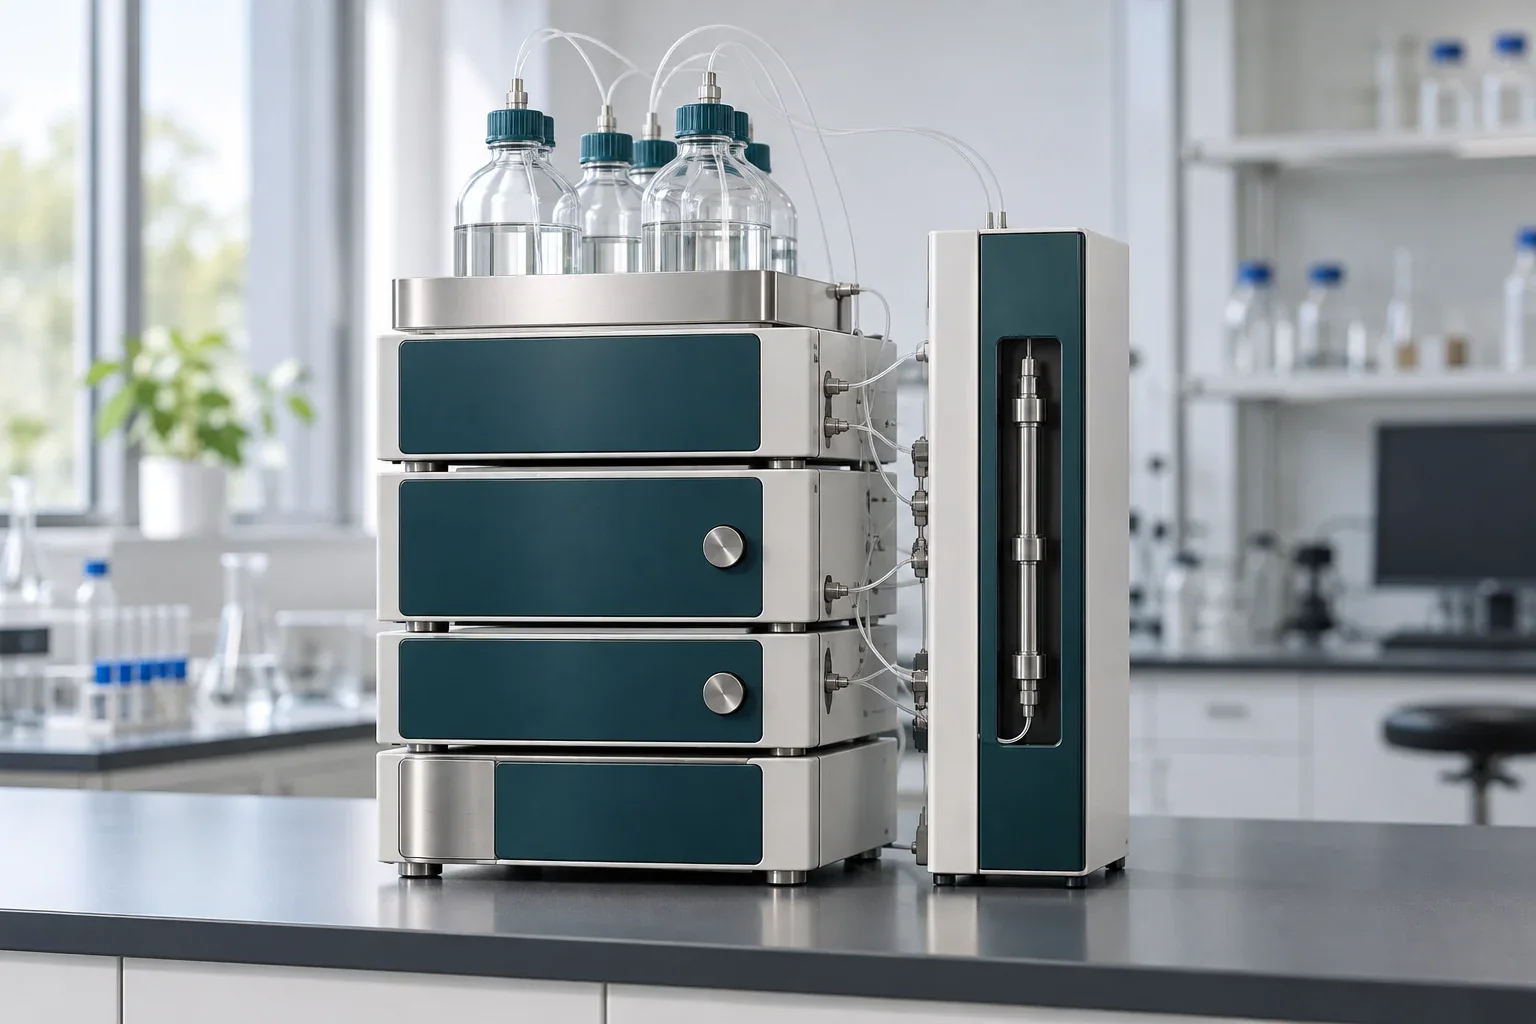
Separates dissolved polymer chains according to their hydrodynamic size. With suitable calibration and detectors, the molecular weight distribution is determined. A shift in the molecular weight distribution, or a change in its breadth compared with a reference, can indicate a change in chain length, including possible chain scission. Comparing these data with thermal history and flow behavior helps trace a drop in viscosity or differences in batch performance; the limitation posed by any insoluble fraction of the sample must be taken into account.
Test, sample and output details
Molecular weight distribution
The dissolved sample passes through the column, and the output data are interpreted to compare the molecular weight distribution and its averages.
Sample
Polymer soluble in a solvent compatible with the system
Output
Chromatogram and molecular weight distribution, depending on the calibration method
Limits of interpretation
Any insoluble fraction, the solvent type and the calibration matter when interpreting the result.
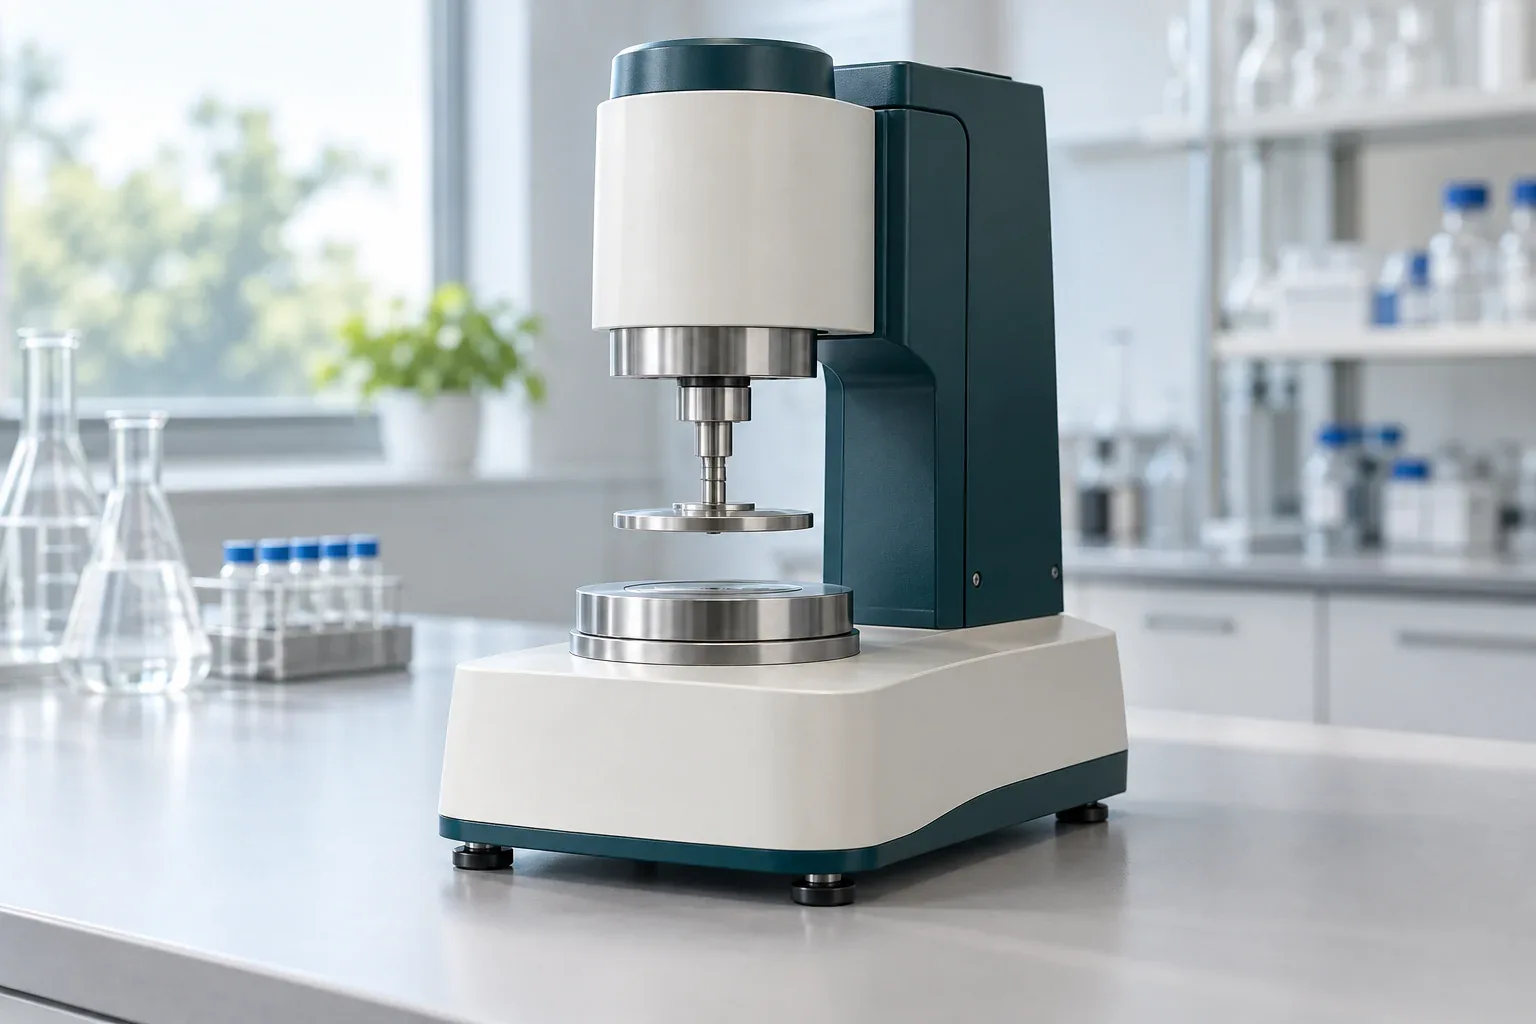
Measures the response of a material to shear or deformation; used to examine the viscosity and viscoelastic behavior of melts, resins and polymer systems. Measuring viscosity and viscoelastic response at a defined temperature and shear rate or frequency shows under which conditions the flow of samples differs most. This information is used to investigate process instability, compare grades and assess the effect of formulation changes, and it provides a basis for choosing process-improvement trials.
Test, sample and output details
Flow and viscoelasticity testing
The viscosity or oscillatory response of the sample is measured at a defined temperature and conditions to compare its flow and deformation behavior.
Sample
Polymer melt, resin, solution or system compatible with the test geometry
Output
Viscosity curves or viscoelastic parameters
Limits of interpretation
Temperature, geometry and shear history must be identical or stated when comparing data.
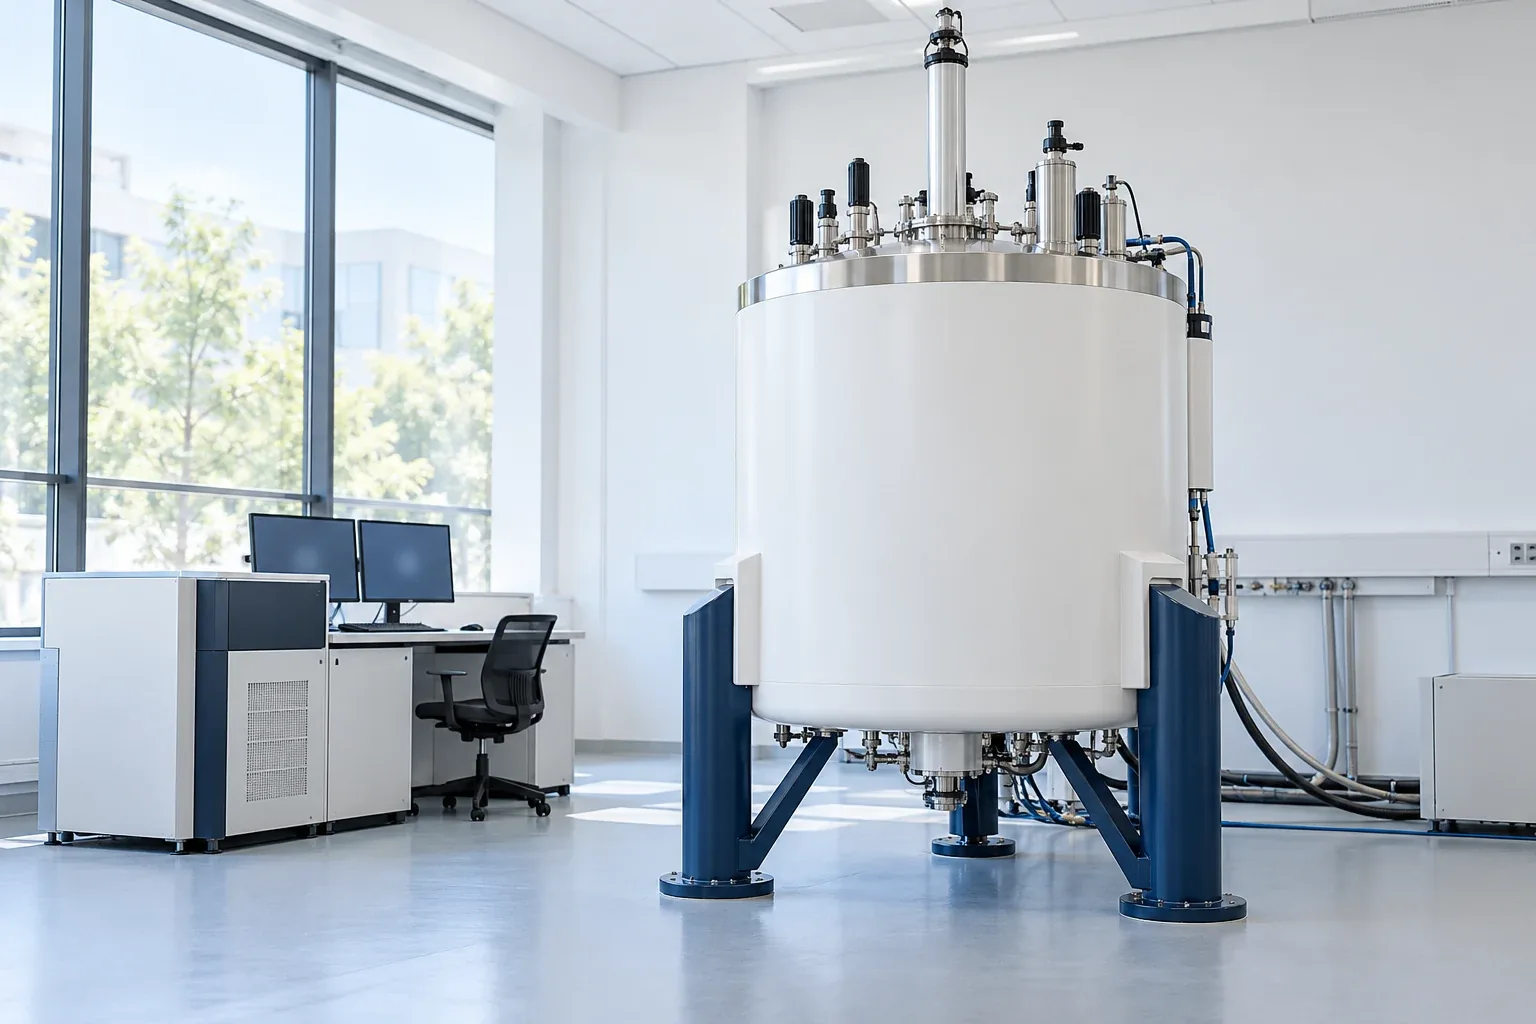
Records the response of nuclei such as hydrogen and carbon in a magnetic field. The NMR spectrum helps determine chemical structure, copolymer composition and chain end groups. Under suitable conditions, chemical shifts and the integrals of resolved signals help assess the structure of repeat units and the ratio of copolymer components. Comparing a sample with a reference can reveal structural or compositional differences when tracing a material non-conformance; quantitative measurement requires appropriate sample preparation and test settings.
Test, sample and output details
Polymer structure and composition by NMR
The position and intensity of signals in ¹H and ¹³C spectra are examined to assess the structure of repeat units and the composition of the sample. Quantitative measurement requires an appropriate test design.
Sample
For solution NMR: polymer dissolved in a suitable solvent; insoluble samples may require solid-state NMR.
Output
NMR spectrum and structural interpretation; under suitable conditions, the ratio of copolymer components or end groups
Limits of interpretation
Signal overlap, solubility and acquisition conditions affect interpretation and quantitative measurement.
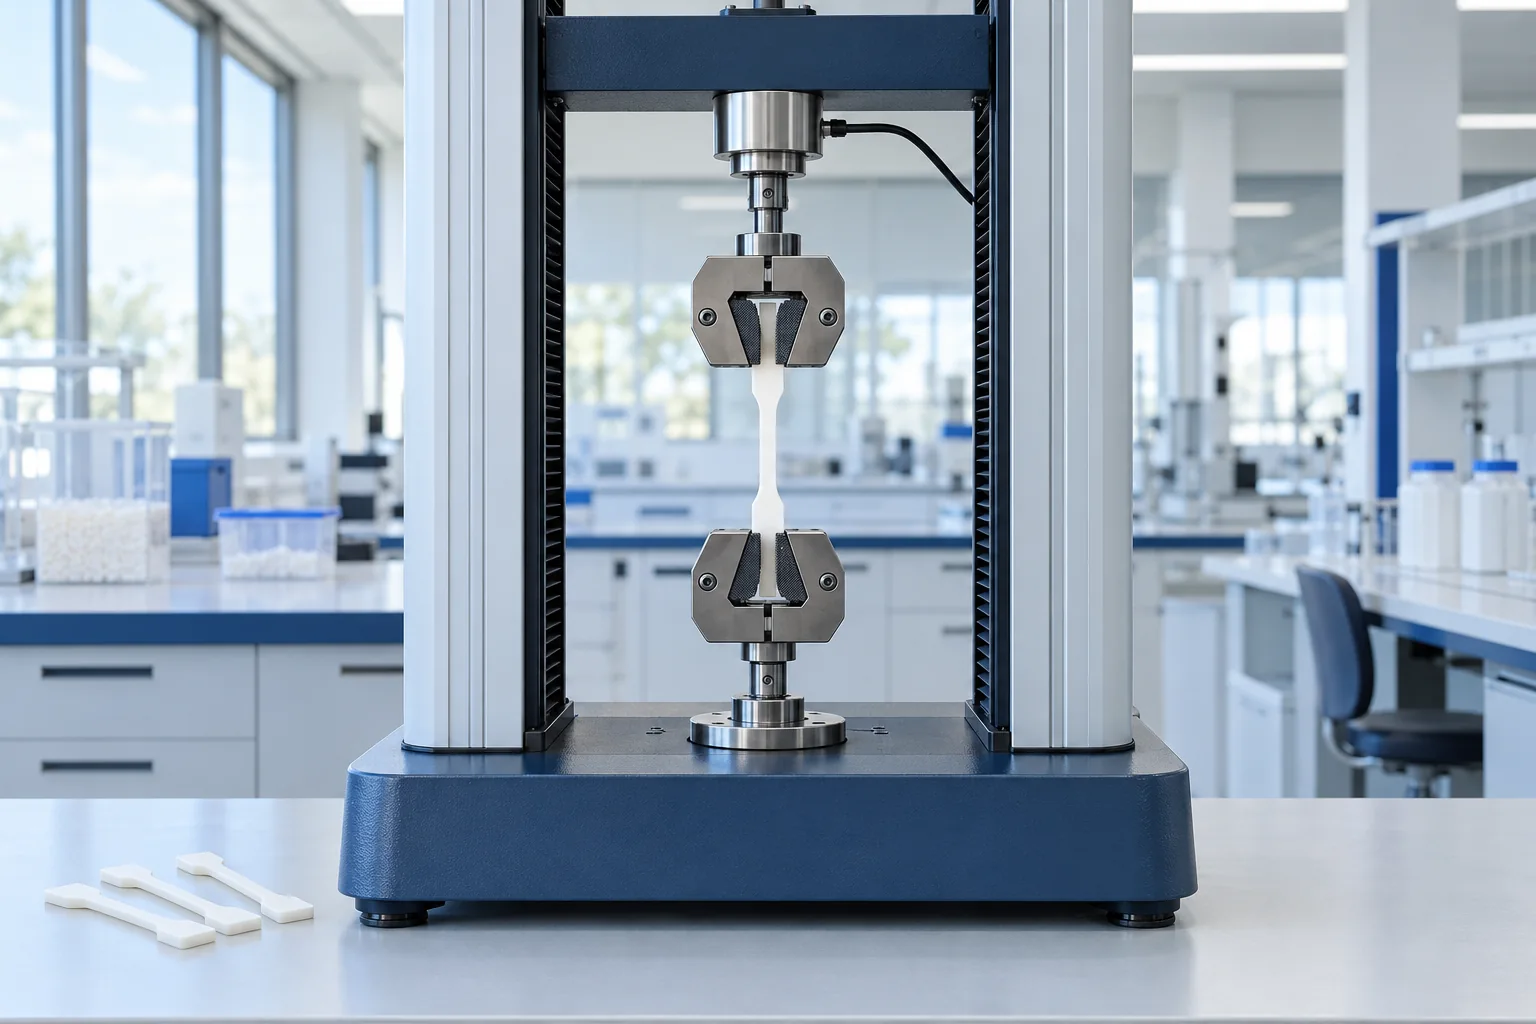
The sample is pulled between two grips while force and elongation are recorded. The test is used to examine the strength and deformation of polymers under tensile load. Comparing the stress–strain curves of good and problem samples shows whether the main change is in tensile stiffness, strength or the ability to deform before break. This evidence is useful for assessing the effect of grade, formulation or production conditions on a loss of mechanical performance, but determining the cause of failure requires a review of service conditions and complementary tests.
Test, sample and output details
Tensile testing and tensile strength of polymers
Sample behavior under controlled tension is examined to assess tensile strength, tensile modulus and elongation. The test method is chosen according to the type and form of the material; ASTM D638 and ISO 527 are common references for plastics.
Sample
Dumbbell or strip specimen with dimensions to suit the method; the material type, thickness, cutting direction and conditioning must be stated.
Output
Stress–strain curve; tensile strength, tensile modulus, elongation at break and, where observed, yield stress
Limits of interpretation
Test speed, temperature, humidity, specimen geometry and the strain measurement method affect the results; data from different methods are not directly equivalent.
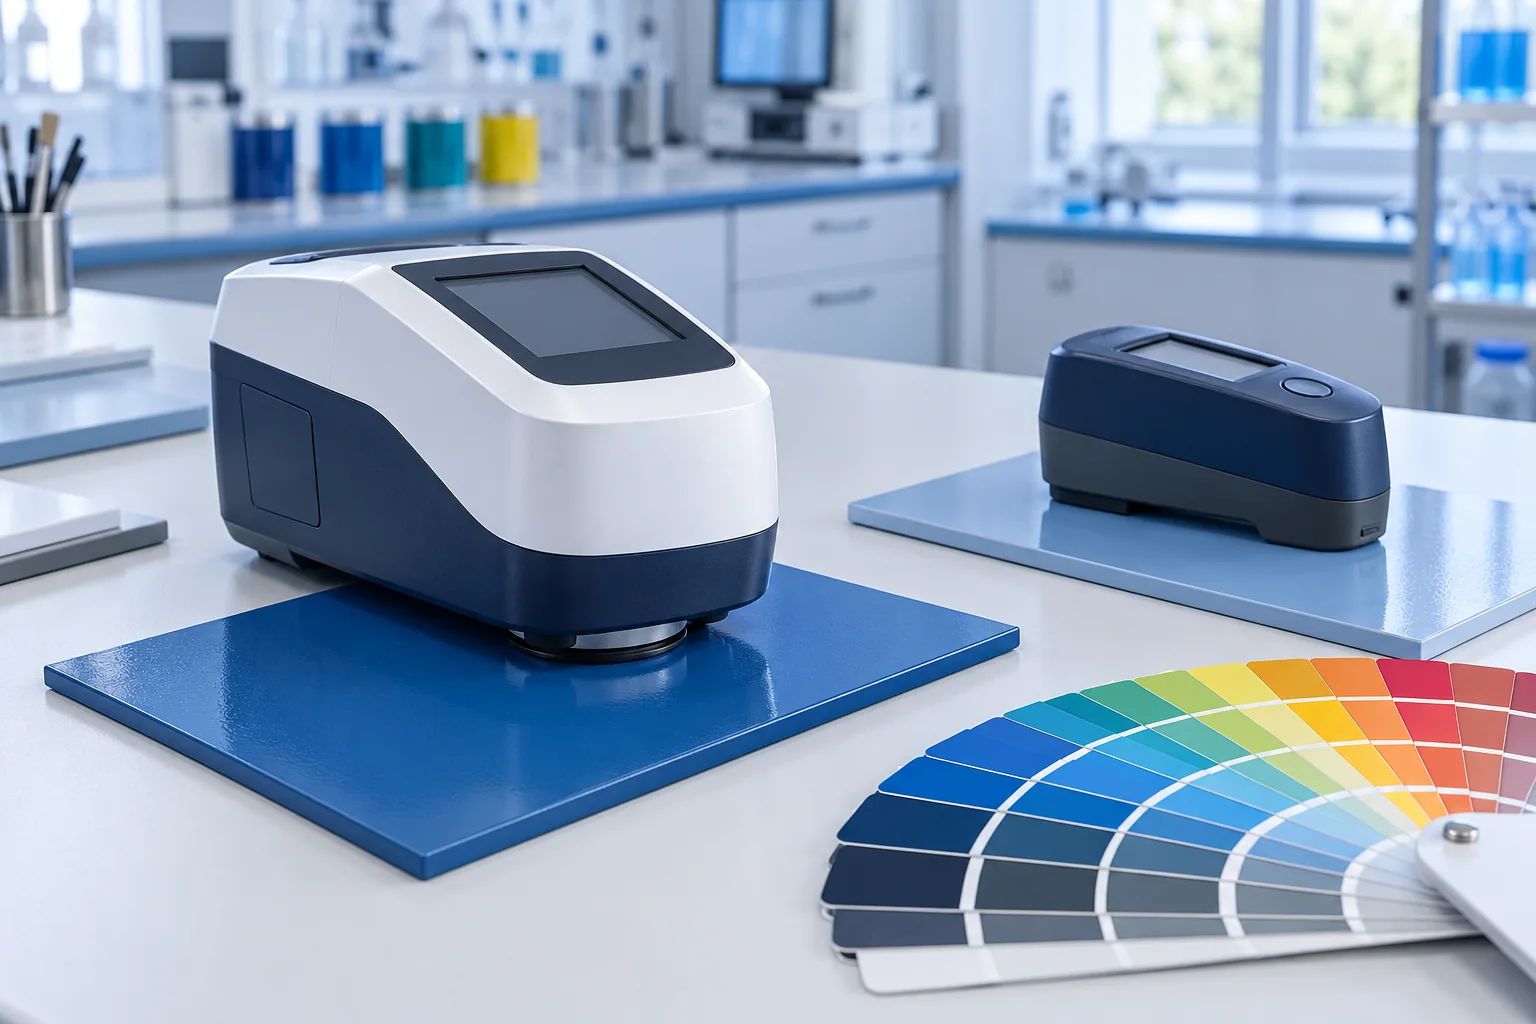
A set of instruments for assessing color and color difference, gloss, adhesion, hardness and film thickness. Depending on the purpose of the test, a colorimeter, gloss meter, adhesion tools, hardness tester and thickness gauge are used. Comparing color difference and gloss against a reference, together with assessing adhesion, hardness and film thickness, shows whether a non-conformance relates mainly to the coating's appearance or to its performance. Reviewing these results alongside the substrate type and the application and curing conditions helps prioritize changes to the formulation, surface preparation or process settings.
Test, sample and output details
Color and coating tests
Checking color match and uniformity of appearance, examining coating adhesion to the substrate, and comparing hardness and film thickness to assess quality and the effect of formulation or curing conditions.
Sample
Coated panel or part with a stated substrate, application method and curing conditions; a reference sample is needed for colorimetry, and a freshly applied sample for wet film thickness.
Output
Color difference from the reference, gloss value, adhesion rating or stress, hardness index and film thickness, depending on the tests selected.
Limits of interpretation
Illumination and measuring geometry, roughness, substrate, thickness and curing conditions affect the results. The method and acceptance criterion for each test must be defined; results from different methods are not necessarily equivalent.
 SEM